
ESP32-S3 JTAG Debugging User Guide
## 1 The ESP32-S3 support use the JTAG pins or USB pins for JTAG debugging. For more instructions,please read the “ESP32-S3 JTAG Debugging ”guide.
- The ESP32-S3 JTAG pins are GPIO39~GPIO42, please read the "ESP32-S3 pins and JTAG signals " instructions.
For debugging with JTAG pins, you need to use the ESP-PROG tool.
| ESP32-S3 Pin | JTAG Signal |
|---|---|
| MTDO / GPIO40 | TDO |
| MTDI / GPIO41 | TDI |
| MTCK / GPIO39 | TCK |
| MTMS / GPIO42 | TMS |
- ESP32-S3 has a built-in JTAG circuitry and can be debugged without any additional chip. Only an USB cable connected to the D+/D- pins is necessary. The necessary connections are shown in the following section. Please read the "Configure ESP32-S3 built-in JTAG Interface " instructions.
ESP32-S3 Pin | USB Signal |
|---|---|
| GPIO19 | D- |
| GPIO20 | D+ |
| 5V | V_BUS |
| GND | Ground |
2 Before JTAG debugging , please set up the esp-idf SDK software environment. please refer to the "ESP-IDF Programming Guide " .The ESP32-S3 only supports release/v4.4 and later version of the ESP-IDF SDK. Please refer to the “ESP-IDF Release and SoC Compatibility” instructions.
The software development environment we recommend to you is the simplest.
-
For windows ,You can use “ESP-IDF Tools Installer ” to install ESP-IDF SDK Environment . Please refer to the “Set up the ESP-IDF SDK compilation environment + Visual Studio Code software programming environment” guide.
-
For Ubuntu(We recommend) , Please read "Standard Setup of Toolchain for Linux " instructions. You can also refer to the “How to set up the software development environment ESP-IDF for ESP32-S3” guide.
3 The following are the JTAG debugging steps:
- Under the esp-idf SDK compilation environment, to open the “openocd” environment,Please refer to the "Run OpenOCD " . For example,
openocd -f C:\Users\caiguanhong\.espressif\tools\openocd-esp32\v0.10.0-esp32-20211111\openocd-esp32\share\openocd\scripts\board\esp32s3-builtin.cfg
- Next , to flash the firmware:
idf.py flash
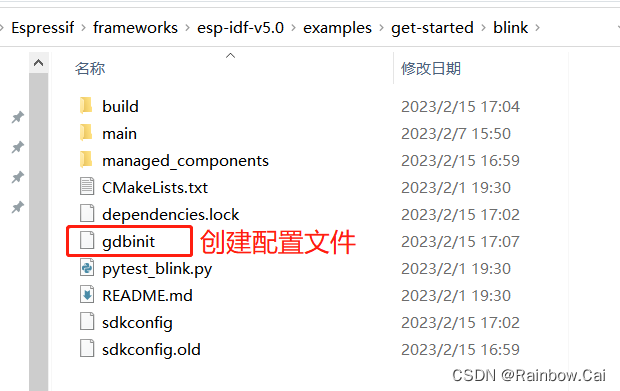
- Then , Under the current debug project, create a configuration file named “gdbinit” and write the following. Please read the “Command Line ” instructions.
target remote :3333
set remote hardware-watchpoint-limit 2
mon reset halt
flushregs
thb app_main
c
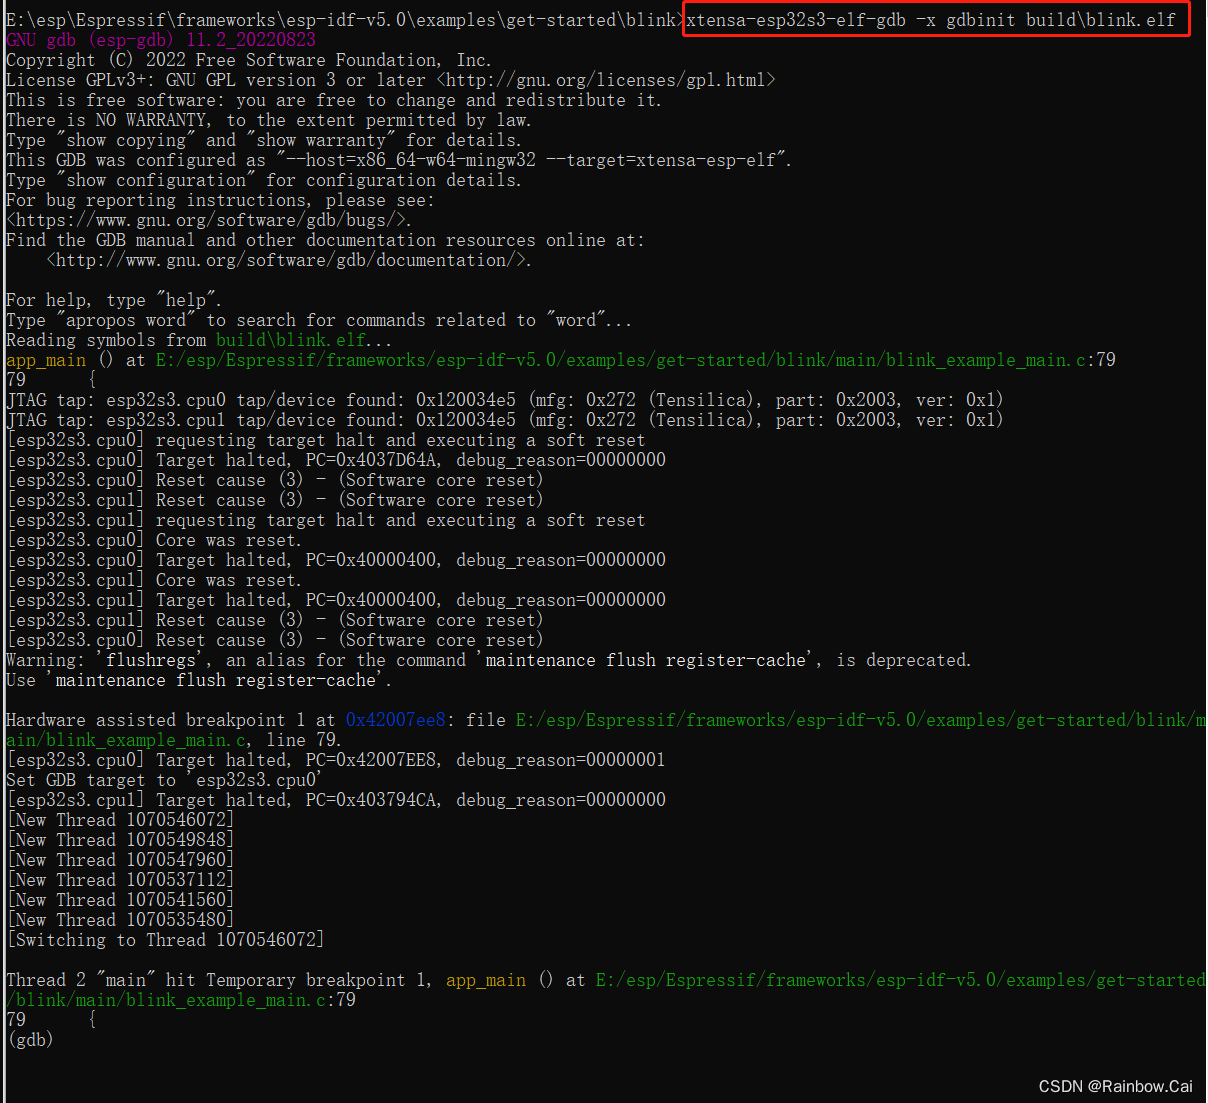
- Last , to enable the “GDB” environment. Please refer to “” . For example,
xtensa-esp32s3-elf-gdb -x gdbinit build\hello_world.elf
- The BSDL file can refer to “openocd-esp32 ” Source Code.
上一篇:Learning C++ No.16【STL No.6】栈和队列
下一篇:Unity3d C#使用DOTween插件的Sequence实现系列动画OnComplete无效和颜色设置无效的问题记录