
ML@二分类中的评价指标@ROC@F-Score@调和均值
文章目录
- ROC曲线
- 例
- 混淆矩阵@误差矩阵
- 混淆表🎈
- Youden's J statistic
- F-score
- F1F_1F1
- FβF_βFβ score🎈
- 调和平均数
- 直观解释和例子
ROC曲线
- Receiver operating characteristic - Wikipedia
- 在信号检测理论中,接收者操作特征曲线,或者叫ROC曲线(英语:Receiver operating characteristic curve),是一种坐标图式的分析工具,用于选择最佳的信号侦测模型、舍弃次佳的模型或者在同一模型中设置最佳阈值。
- 在做决策时,ROC分析能不受成本/效益的影响,给出客观中立的建议。
- 数十年来,ROC分析被用于医学、无线电、生物学、犯罪心理学领域中,而且最近在机器学习(machine learning)和数据挖掘(data mining)领域也得到了很好的发展。
- ROC(Receiver Operating Characteristic)曲线是一种用于评估二分类模型性能的可视化工具。
- 在ROC曲线上,
- 横轴表示假阳性率(False Positive Rate,FPR),即被错误地预测为正类的负样本数占总负样本数的比例;
- 纵轴表示真阳性率(True Positive Rate,TPR),即被正确地预测为正类的正样本数占总正样本数的比例。
- ROC曲线能够展示在不同的分类阈值下,模型的真阳性率和假阳性率的变化情况,从而帮助我们更好地理解模型在不同阈值下的性能表现。
- 在ROC曲线上,理想的分类器应该尽可能地靠近左上角,此时真阳性率很高,而假阳性率很低。如果分类器在ROC曲线上的表现是一条从左下角到右上角的直线,那么它的预测能力等同于随机猜测,即没有预测能力。
- ROC曲线下面积(Area Under Curve,AUC)也是评估模型性能的一个重要指标,AUC的取值范围在0.5到1之间,AUC越接近1,表示模型性能越好。
例
-
分类模型(又称分类器,或诊断)是将一个实例映射到一个特定类的过程。ROC分析的是二元分类模型,也就是输出结果只有两种类别的模型,例如:(阳性/阴性)(有病/没病)(垃圾邮件/非垃圾邮件)(敌军/非敌军)。
-
当信号侦测(或变量测量)的结果是一个连续值时,类与类的边界必须用一个阈值(英语:threshold)来界定。举例来说,用血压值来检测一个人是否有高血压,测出的血压值是连续的实数(从0~200都有可能),以收缩压140/舒张压90为阈值,阈值以上便诊断为有高血压,阈值未满者诊断为无高血压。二元分类模型的个案预测有四种结局:
- 真阳性(TP):诊断为有,实际上也有高血压。
- 伪阳性(FP):诊断为有,实际却没有高血压。
- 真阴性(TN):诊断为没有,实际上也没有高血压。
- 伪阴性(FN):诊断为没有,实际却有高血压。
-
混淆矩阵

混淆矩阵@误差矩阵
-
Confusion matrix - Wikipedia
-
在机器学习领域和统计分类问题中,混淆矩阵(英语:confusion matrix)是可视化工具,特别用于监督学习,在无监督学习一般叫做匹配矩阵。
-
矩阵的每一列代表一个类的实例预测,而每一行表示一个实际的类的实例。
-
之所以如此命名,是因为通过这个矩阵可以方便地看出机器是否将两个不同的类混淆了(比如说把一个类错当成了另一个)。
-
混淆矩阵(也称误差矩阵 )是一种特殊的, 具有两个维度的(实际和预测)列联表(英语:contingency table),并且两维度中都有着一样的类别的集合。
-
如果已经训练好了一个系统用来区分猫和狗,那混淆矩阵就可以概括算法的测试结果以便将来的检查。假设一个13个动物的样本,8只猫和5只狗,那混淆矩阵的结果可能如下表所示
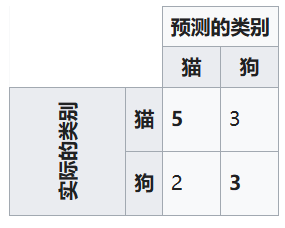
- 在这个混淆矩阵中,系统预测了8只实际的猫(8只猫作为输入),而分类预测系统事先是不知道这8只输入具体是什么,预测计算后"认为"其中3只是狗(即错误了3只,系统将猫分类为了狗)
- 类似的,5只狗中,则预测有2只是猫。(系统将5只狗中的某两只错误地分类为猫)
- 所有正确的预测都位于表格的对角线上(以粗体突出显示),因此很容易从视觉上检查表格中的预测错误,因为它们将由对角线之外的值表示。
- 如果减少一些细节,只统计将输入的8猫5狗预出7猫6狗,这看上去好像预测的还行(最好的情况下只判错了一只)
- 然而根据混淆矩阵揭示的细节可知,出现了许多类似
负负得正的若干预测,实际的预测效果实际并不好
- 然而根据混淆矩阵揭示的细节可知,出现了许多类似
混淆表🎈
- 在预测分析中,混淆表(有时也称为混淆矩阵)是具有两行两列的表,该表报告假阳性,假阴性,真阳性和真阴性的数量。
- 这不仅可以进行正确分类(准确度)的分析,还可以进行更详细的分析。
- 对于分类器的真实性能,准确性不是可靠的指标,因为如果数据集不平衡(即,当不同类别中的观察数发生很大变化时),它将产生误导性结果。
- 例如,如果数据中有95只猫,只有5条狗,
- 特定的分类器可能会将所有观察结果归为猫。总体准确度为95%
- 但更详细地,分类器对猫类别的识别率为100%(敏感性),对狗类别的识别率为0%。
- 在这种情况下,F1得分(英语:F1 score)甚至更加不可靠,在这种情况下,F1得分将超过97.4%,
- 约登指数则消除了这种偏见,并且将0作为乱猜情况下能增加信息量的决定(英语:informed decision)的概率(例如,这里总是猜测猫)。
- 约登指数为0的系统或测试不具有任何作用
- J=9595+0+00+5−1=0{\displaystyle J={\frac {95}{95+0}}+{\frac {0}{0+5}}-1=0}J=95+095+0+50−1=0 (总是猜测猫的约登指数)
- 将猫视为阳性,将狗视为阴性
- TP=95,TF=0(预测正确的两类情况及其次数)
- 把猫预测为猫的次数为95
- 把狗预测为狗的次数为0
- NP=5,NF=0(预测错误的两类情况及其次数)
- 把狗预测为猫的次数为5
- 把猫预测为狗的次数为0
- 能熟练的将四个变量和含义对应起来,是正确计算JJJ的关键,将简单的例子反复练习也很有用
- 也就是,系统若预测的对,具体怎么对,是把猫预测为猫,还是把狗预测为狗
- 系统若预测错了,具体怎么错,是把狗预测为猫还是把猫预测为狗
- J=9595+0+00+5−1=0{\displaystyle J={\frac {95}{95+0}}+{\frac {0}{0+5}}-1=0}J=95+095+0+50−1=0 (总是猜测猫的约登指数)
Youden’s J statistic
-
Youden’s J statistic - Wikipedia
-
Youden’s J statistic (also called Youden’s index) is a single statistic that captures the performance of a dichotomous diagnostic test. Informedness is its generalization to the multiclass case and estimates the probability of an informed decision.
-
dichotomous diagnostic test指的是二元诊断测试,即测试结果只有两种可能性的诊断测试。在医学领域中,常见的二元诊断测试包括阳性和阴性测试结果、患病和未患病的结果等。
-
二元诊断测试通常用于评估某种疾病或者症状的存在或者缺失,或者判断某种治疗方法是否有效等。常见的二元诊断测试方法包括血液检测、尿液检测、X光检查等。
-
二元诊断测试在机器学习领域中也有广泛的应用,如二元分类问题中的模型评估和选择最佳阈值等。
-
Youden’s J statistic is:
-
J=sensitivity+specificity−1{\displaystyle J={\text{sensitivity}}+{\text{specificity}}-1}J=sensitivity+specificity−1
-
J = 灵敏度 +特异度 − 1
-
sensitivity=true positivestrue positives+false negatives=TPTP+FNspecificity=true negativestrue negatives+false positives=TNTN+FP\text{sensitivity}={\frac {\text{true positives}}{{\text{true positives}}+{\text{false negatives}}}} =\frac{TP}{TP+FN} \\ \text{specificity}={\frac {\text{true negatives}}{{\text{true negatives}}+{\text{false positives}}}} =\frac{TN}{TN+FP} sensitivity=true positives+false negativestrue positives=TP+FNTPspecificity=true negatives+false positivestrue negatives=TN+FPTN
-
其中TP+FN表示实际阳性的数量;TN+FP表示实际阴性的数量
-
-
with the two right-hand quantities(等式右侧) being sensitivity and specificity. Thus the expanded formula is:
-
J=true positivestrue positives+false negatives+true negativestrue negatives+false positives−1{\displaystyle J={\frac {\text{true positives}}{{\text{true positives}}+{\text{false negatives}}}} +{\frac {\text{true negatives}}{{\text{true negatives}}+{\text{false positives}}}}-1} J=true positives+false negativestrue positives+true negatives+false positivestrue negatives−1
-
J∈[−1,1]J\in[-1,1]J∈[−1,1]
-
证明:
-
TP,NP,TN,FNTP⩽TP+FNTN⩽TN+FP0⩽TPTP+FN⩽10⩽TNTN+FP⩽1∴0⩽TPTP+FN+TNTN+FP⩽2−1⩽J⩽1TP,NP,TN,FN \\ TP\leqslant{TP+FN} \\ TN\leqslant{TN+FP} \\ {0}\leqslant\frac{TP}{TP+FN}\leqslant{1} \\ 0\leqslant{\frac{TN}{TN+FP}}\leqslant{1} \\ \therefore{0\leqslant{\frac{TP}{TP+FN}+\frac{TN}{TN+FP}}\leqslant{2}} \\ -1\leqslant{J}\leqslant{1} TP,NP,TN,FNTP⩽TP+FNTN⩽TN+FP0⩽TP+FNTP⩽10⩽TN+FPTN⩽1∴0⩽TP+FNTP+TN+FPTN⩽2−1⩽J⩽1
-
-
在Youden’s J统计量的计算公式中,sensitivity和specificity是指在二元分类问题中的两个重要指标,分别表示真实标签为正类的样本被正确地预测为正类的比例和真实标签为负类的样本被正确地预测为负类的比例。
-
在Youden’s J统计量的计算公式中,sensitivity和specificity被称作右侧的两个量,是指在公式中出现在右侧的两个量。
-
-
Youden’s J统计量(也称为Youden指数)是捕捉二元诊断测试性能的单个统计量。在二元分类问题中,Youden’s J统计量是真阳性率和真阴性率之差的绝对值的最大值。
-
在实际应用中,Youden’s J统计量可以作为评价模型性能的一个指标。
-
F-score
-
F-score - Wikipedia
-
In statistical analysis of binary classification, the F-score or F-measure is a measure of a test’s accuracy. It is calculated from the precision and recall of the test, where :
-
the precision is the number of true positive results divided by the number of all positive results, including those not identified correctly
- P=TPTP+FPP=\frac{TP}{TP+FP} P=TP+FPTP
-
the recall is the number of true positive results divided by the number of all samples that should have been identified as positive. Precision is also known as positive predictive value, and recall is also known as sensitivity in diagnostic binary classification.
- R=TPTP+FNR=\frac{TP}{TP+FN} R=TP+FNTP
-
-
Precision (also called positive predictive value) is the fraction of relevant instances among the retrieved instances,
- 所有被预测为阳性的样本中真实为阳性的样本的占比
-
recall (also known as sensitivity) is the fraction of relevant instances that were retrieved. Both precision and recall are therefore based on relevance.
- 所有真实阳性样本中,被正确预测(为阳性)的样本数占比
-
Consider a computer program for recognizing dogs (the relevant element) in a digital photograph. Upon processing a picture which contains ten cats and twelve dogs, the program identifies eight dogs. Of the eight elements identified as dogs, only five actually are dogs (true positives), while the other three are cats (false positives). Seven dogs were missed (false negatives), and seven cats were correctly excluded (true negatives). The program’s precision is then 5/8 (true positives / selected elements) while its recall is 5/12 (true positives / relevant elements).
-
The F1F_1F1 score is the harmonic mean of the precision and recall. It thus symmetrically represents both precision and recall in one metric. The more generic FβF_{\beta }Fβ score applies additional weights, valuing one of precision or recall more than the other.
The highest possible value of an F-score is 1.0, indicating perfect precision and recall, and the lowest possible value is 0, if either precision or recall are zero. -
F值,亦被称做F-measure,是一种量测算法的精确度常用的指标,经常用来判断算法的精确度。目前在辨识、侦测相关的算法中经常会分别提到精确率(precision)和召回率(recall),F-score能同时考虑这两个数值,平衡地反映这个算法的精确度。
F1F_1F1
- The traditional F-measure or balanced F-score (F1 score) is the harmonic mean of precision and recall:
F1=2recall−1+precision−1=2precision⋅recallprecision+recall=2tp2tp+fp+fn{\displaystyle F_{1}={\frac {2}{\mathrm {recall} ^{-1}+\mathrm {precision} ^{-1}}}=2{\frac {\mathrm {precision} \cdot \mathrm {recall} }{\mathrm {precision} +\mathrm {recall} }}={\frac {2\mathrm {tp} }{2\mathrm {tp} +\mathrm {fp} +\mathrm {fn} }}}F1=recall−1+precision−12=2precision+recallprecision⋅recall=2tp+fp+fn2tp. - 一般上来说,提到F-score且没有特别的定义时,是指β=1\beta =1β=1时的F-score,亦有写作F1F_1F1-score。
- 代表使用者同样的注重precision和recall的这两个指标。其分数可以说是precision和recall的调和平均
FβF_βFβ score🎈
-
A more general F score, FβF_{\beta }Fβ, that uses a positive real factor β\betaβ, where β\betaβ is chosen such that recall is considered β\betaβ times as important as precision, is:
-
Fβ=(1+β2)⋅precision⋅recall(β2⋅precision)+recallF_\beta = (1 + \beta^2) \cdot \frac{\mathrm{precision} \cdot \mathrm{recall}}{(\beta^2 \cdot \mathrm{precision}) + \mathrm{recall}} Fβ=(1+β2)⋅(β2⋅precision)+recallprecision⋅recall
-
F1F_1F1-Score就是β=1\beta=1β=1时的FβF_\betaFβ一种特殊情况
-
-
In terms of Type I and type II errors this becomes:(用TP/FN/FP)表示
- Fβ=(1+β2)⋅truepositive(1+β2)⋅truepositive+β2⋅falsenegative+falsepositiveF_\beta = \frac {(1 + \beta^2) \cdot \mathrm{true\ positive} }{(1 + \beta^2) \cdot \mathrm{true\ positive} + \beta^2 \cdot \mathrm{false\ negative} + \mathrm{false\ positive}}\, Fβ=(1+β2)⋅true positive+β2⋅false negative+false positive(1+β2)⋅true positive
-
Two commonly used values for β\betaβ are 2, which weighs recall higher than precision, and 0.5, which weighs recall lower than precision.
调和平均数
-
调和平均数(英语:harmonic mean),在数学中,调和平均数是几种平均数之一,特别的,是毕达哥拉斯平均数之一。当需要计算平均速率时,调和平均数是一个合适的选择。In mathematics, the harmonic mean is one of several kinds of average, and in particular, one of the Pythagorean means. It is sometimes appropriate for situations when the average rate is desired.
-
调和平均数是将所有数值取倒数并求其算术平均数后,再将此算术平均数取倒数而得,其结果等于数值的个数除以数值倒数的总和。
-
一组正数x1,x2,⋯,xn{\displaystyle x_{1},x_{2},\cdots ,x_{n}}x1,x2,⋯,xn的调和平均数HHH其计算公式为:
- H=n1x1+1x2+...+1xn=(1n∑i=1n1xi)−1=n∑i=1n1xiH={\frac {n}{{\frac {1}{x_{1}}}+{\frac {1}{x_{2}}}+...+{\frac {1}{x_{n}}}}} =({\frac{1}{n}{\sum _{{i=1}}^{n}{\frac {1}{x_{i}}}}})^{-1} ={\frac {n}{\sum _{{i=1}}^{n}{\frac {1}{x_{i}}}}} H=x11+x21+...+xn1n=(n1i=1∑nxi1)−1=∑i=1nxi1n
直观解释和例子
- 可以将调和平均数看作是一组数据的倒数的平均值。如果一组数据表示的是速度或者频率等与时间有关的物理量,那么对它们求调和平均数可以得到平均速度或平均频率。
- 举个例子,如果一个人在往返两地的路上以 4m/s 的速度去,以 6m/s 的速度回来,那么这个人的平均速度就可以用这两个速度的调和平均数计算得出。
- 我们可以先从小学的角度计算这个来回平均速度
- 设A,B两地距离为S,从A到B以4m/s4m/s4m/s的速度前进,耗时t1t_1t1;B到A的速度以6m/s6m/s6m/s速度前进,耗时t2t_2t2
- 则S=4t1=6t2S=4t_1=6t_2S=4t1=6t2
- t1=14St_1=\frac{1}{4}St1=41S
- t2=16St_2=\frac{1}{6}St2=61S
- v‾=2St1+t2=2S14S+16S\overline{v}=\frac{2S}{t_1+t_2}=\frac{2S}{\frac{1}{4}S+\frac{1}{6}S}v=t1+t22S=41S+61S2S
- =243+2=4.8m/s=\frac{24}{3+2}=4.8m/s=3+224=4.8m/s
- 如果不稍加思考,容易得出平均速度为12(4+6)=5m/s\frac{1}{2}(4+6)=5m/s21(4+6)=5m/s的错误结论
- 因为t1:t2=3:2t_1:t_2=3:2t1:t2=3:2,t1≠t2t_1\neq{t_2}t1=t2,不能够直接计算速度的平均值
- 并且对比上述形式,符合调和平均数的形式
- 由于S会被消掉,所以可以设路程为1,并且将两个速度设为x1,x2x_1,x_2x1,x2,则v‾=Sx1−1+x2−1\overline{v}=\frac{S}{x_1^{-1}+x_2^{-1}}v=x1−1+x2−1S